Whether you’re redesigning a landing page, trying to improve product usability, or just curious where users are clicking most, heatmaps are one of the simplest yet most powerful tools you can use for analytical purposes in your digital marketing.
In this heatmap guide coming from our 7+ years of digital marketing experience with contractors, we’ll break down what heatmaps are, why they matter, and how to start using them to get actionable insights about user behavior. The most common heatmap providing companies you can try out to start are: Hotjar and Microsoft Clarity
What is a Heatmap?
A heatmap is a visual representation of data that uses color to show how users interact with a webpage, app, or even an email. Warmer colors (like red and orange) typically show areas with higher engagement, while cooler colors (like blue and green) show less interaction.
The purpose of a heatmap is to make user behavior patterns easy to spot visually without physically written data. Instead of sifting through rows of analytics data, a heatmap gives you a visual snapshot of what users are doing, and what they’re ignoring.
Heatmaps are commonly used in digital marketing to spot flaws on a landing page or to A/B test in order to improve conversion rates and fix holes in marketing funnels. They help analyze website and landing page performance, assess the effectiveness of email marketing campaigns, fine-tune e-commerce conversion strategies, and support product testing and interface design decisions.
2-D Density Plots Are How Heatmaps Are Made
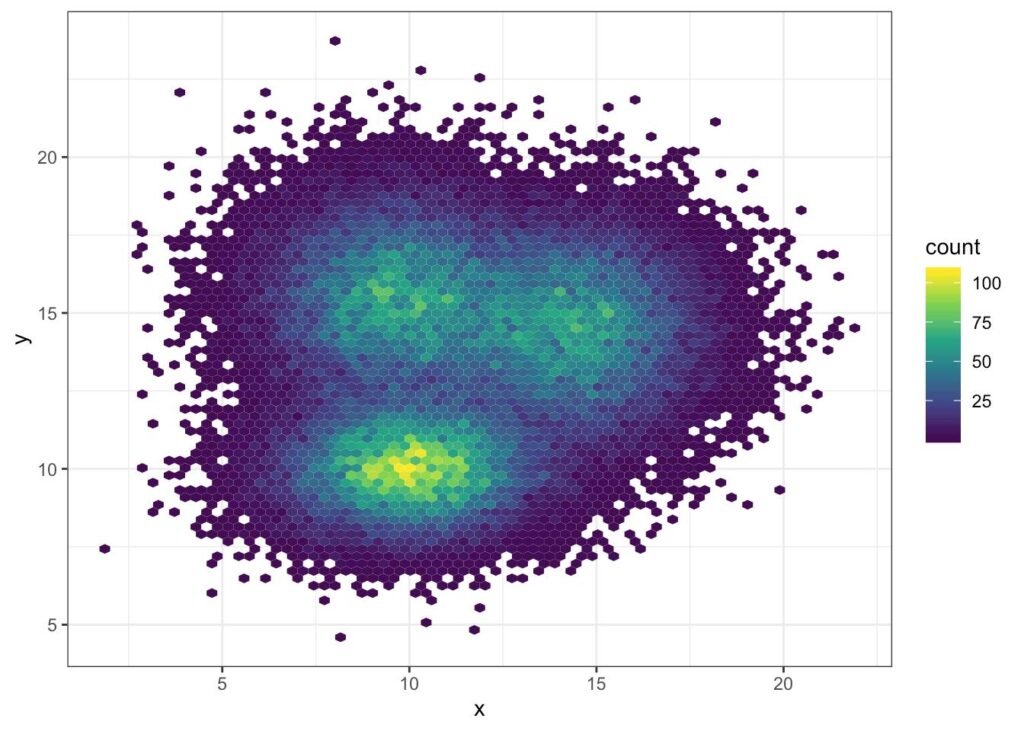
Most heatmaps rely on 2-D density plots. These plots track the user’s interaction data (like mouse movements, clicks, or scroll depth) into colored overlays dots.
From our digital marketing point of view here at Blue Sky Advertisement, this helps teams quickly identify clusters of engagement, friction points, or elements of a given webpage that are not being interacted with, then fix the possible issues on the webpage.
Why Do People Use Heatmaps?
There’s a reason heatmaps are popular among marketers, designers, and product teams alike: they make the decision making process of changing a webpage or landing page easier.
They allow you to highlight high-engagement elements of a webpage, showing exactly what content the user is engaging with. They help you optimize elements like a call-to-action buttons by making it obvious where users naturally click.
Heatmaps also uncover friction points like rage clicks, dead zones, and confusing layouts. All of these insights contribute to improving the overall user experience by understanding the typical user and identifying their key behavior patterns.
So, heatmaps reveal the “what” behind user behavior. Paired with other tools, they help you figure out the “why.” so you can improve your digital marketing overall.
Types of Heatmaps
Heatmaps come in several flavors, each one designed to track a different kind of user behavior.
Click Maps
Click maps show where users are clicking most frequently on a webpage. They’re especially useful for evaluating navigation menus, CTAs, buttons, and links. If users are clicking where they shouldn’t (or not clicking where you want them to) click maps, to make it obvious.
Scroll Maps

Scroll maps show how far users are scrolling down a page. If most people are dropping off before reaching your form or call-to-action, scroll maps help you catch that. They give you clear visibility into where content is losing its grip.
Mouse-Tracking Heatmaps
These heatmaps record where users move their cursors as they navigate a page. While not every mouse movement equates to user attention, patterns in mouse tracking often align with what people are reading or focusing on.
Eye-Tracking Heatmaps
A more advanced method, eye-tracking heatmaps are built from user gaze data, often inferred from mouse behavior. These can be predictive or come from studies using eye-tracking hardware. They’re especially valuable for evaluating design layouts and visual flow.
Engagement Zones
This type of heatmap combines several interaction data points (clicks, scrolls, and mouse movements)bto show intensity of activity. It helps reveal which parts of a page draw the most interaction across devices like desktop, tablet, and mobile.
Best Practices for Using a Heatmap
A great heatmap doesn’t just look good, it communicates clearly. Choosing the right visual setup can make or break the insights you get from it.
Start with a color palette that fits your data type. Sequential color schemes work best for showing gradual changes in engagement, while diverging palettes can highlight extremes. Always include a legend to explain color meanings. Where possible, overlay values for added context. Lastly, organize your data logically to help patterns stand out.
When Should You Use a Heatmap?
Heatmaps are most effective when you’re trying to understand why users behave a certain way, or why they don’t. If a landing page isn’t converting, a heatmap can reveal whether people are scrolling far enough to even see your CTA. If users abandon a checkout flow, a heatmap might show where confusion or distraction sets in.
They’re especially useful during site audits, redesigns, or A/B testing. If you’re launching a new feature, analyzing an existing one, or trying to figure out why bounce rates are high, heatmaps give you the context you need to move forward with clarity.
How Can You Use Heatmaps to Improve Your Product?
Heatmaps aren’t just for marketing, they’re a goldmine for product development too. If you’re trying to refine a product’s layout, assess new features, or improve usability, heatmaps let you see what users do naturally.
If a feature you thought was obvious is getting ignored, or if unexpected elements are drawing attention, heatmaps help bridge the gap between design intent and real-world behavior. They give you a roadmap for iterating based on real evidence, not assumptions.
How to Create a Website Heatmap
The easiest way to get started is with tools like Hotjar and Microsoft Clarity.
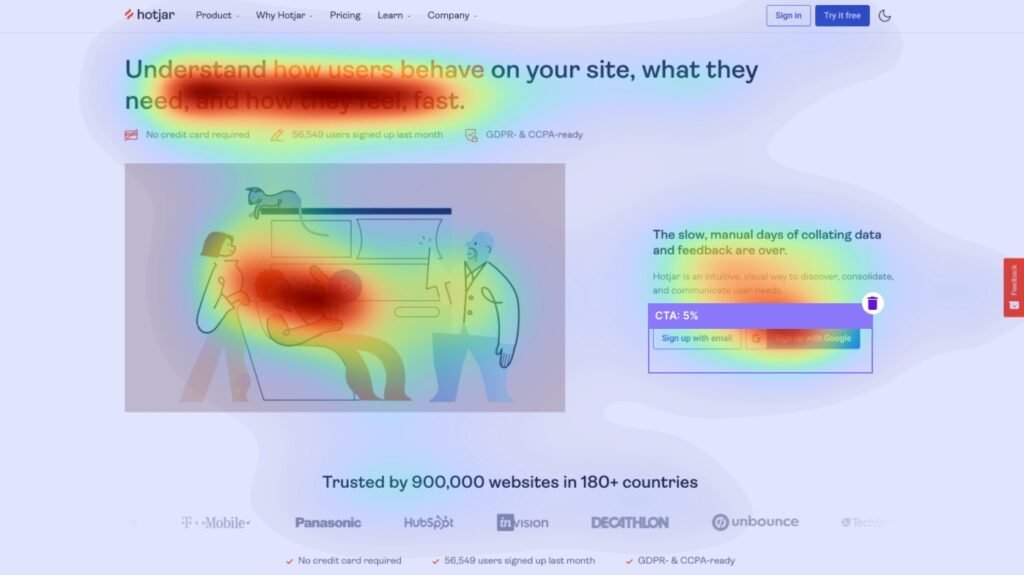
Hotjar is well-known for its easy setup, user-friendly dashboards, and clean visualizations. It allows you to create click maps, scroll maps, and even watch session replays. This makes it a great option for UX designers and marketers who need quick insights without a steep learning curve.
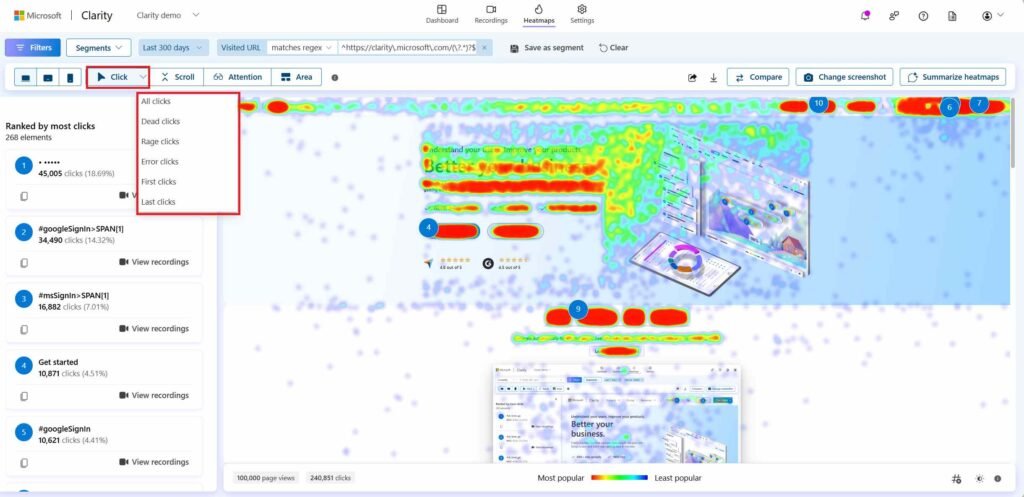
Microsoft Clarity, on the other hand, offers many of the same features, and it’s free. It provides automatic heatmap generation, session recordings, rage click tracking, and detailed filters for segmenting behavior by device or user type. For teams focused on performance and budget, Clarity delivers exceptional value.
Both tools can be installed in just minutes, and they integrate with most CMS platforms and analytics systems. Whether you use Hotjar for its polish or Clarity for its depth, either will give you the heatmap insights needed to improve your digital experience.
Who Can Benefit from Using Heatmaps?
UX Designers use heatmaps to improve navigation flow and remove interface friction. By identifying confusing elements or unclicked features, they can create smoother, more intuitive experiences.
Marketers turn to heatmaps to boost conversion rates. Knowing where users click, and where they don’t, helps fine-tune landing pages, promotional banners, and CTAs.
Product Teams rely on heatmaps to assess how users interact with features in real-time. This data helps prioritize updates, plan redesigns, and align product decisions with actual user behavior.
The Pros and Cons of Heatmaps
Pros of Heatmaps
Heatmaps simplify complex behavioral data into a visual format that’s easy to interpret. They allow teams to quickly spot high-performing elements, understand engagement trends, and act on real-time interaction data without deep technical knowledge.
Cons of Heatmaps
Despite their value, heatmaps have limitations. They show what users are doing, but not why. This means they should be paired with other tools like A/B testing, surveys, or analytics platforms for a full picture. Additionally, they can become noisy without thoughtful filtering or segmentation.
Whether you’re optimizing a landing page or rebuilding a checkout flow, heatmaps offer a quick, intuitive way to see how users engage. With tools like Hotjar and Microsoft Clarity at your fingertips, there’s no reason not to make heatmaps part of your regular optimization routine.